| 구 분 | 생산활동 | 생산요소 | 제도 | 투자 | 세금 | 해외 | 총계 | ||||||||||||
|---|---|---|---|---|---|---|---|---|---|---|---|---|---|---|---|---|---|---|---|
| 국내 재화 | 수입 재화 | 노동 | 자본 | ICT SW 자본 | HW 자본 | 가계 | 기업 | 정부 | 고정 자본 형성 | ICT SW 자본 | HW 자본 | 간접세 | 법인세 | 소득세 | 수출 | 수입 | |||
| 생산 활동 | 국내 재화 | 24*24 | 24*10 | 24*1 | 24*1 | 24*1 | 24*1 | 24*1 | |||||||||||
| 수입 재화 | 24*24 | 24*10 | 24*1 | 24*1 | 24*1 | 24*1 | |||||||||||||
| 생산 요소 | 노동 | 3*24 | |||||||||||||||||
| 자본 | 1*24 | ||||||||||||||||||
| SW자본 | 1*24 | ||||||||||||||||||
| HW자본 | 1*24 | ||||||||||||||||||
| 제도 | 가계 | 10*3 | 10*1 | 10*1 | 10*1 | ||||||||||||||
| 기업 | 1*1 | 1*1 | 1*1 | ||||||||||||||||
| 정부 | 1*10 | 1*1 | 1*1 | ||||||||||||||||
| 투자 | 고정 자본 형성 | 1*10 | |||||||||||||||||
| SW자본 | |||||||||||||||||||
| HW자본 | |||||||||||||||||||
| 세금 | 간접세 | ||||||||||||||||||
| 법인세 | |||||||||||||||||||
| 소득세 | 1*10 | ||||||||||||||||||
| 관세 | 1*24 | ||||||||||||||||||
| 해외 | 수출 | ||||||||||||||||||
| 수입 | 1*24 | ||||||||||||||||||
| 총계 | |||||||||||||||||||
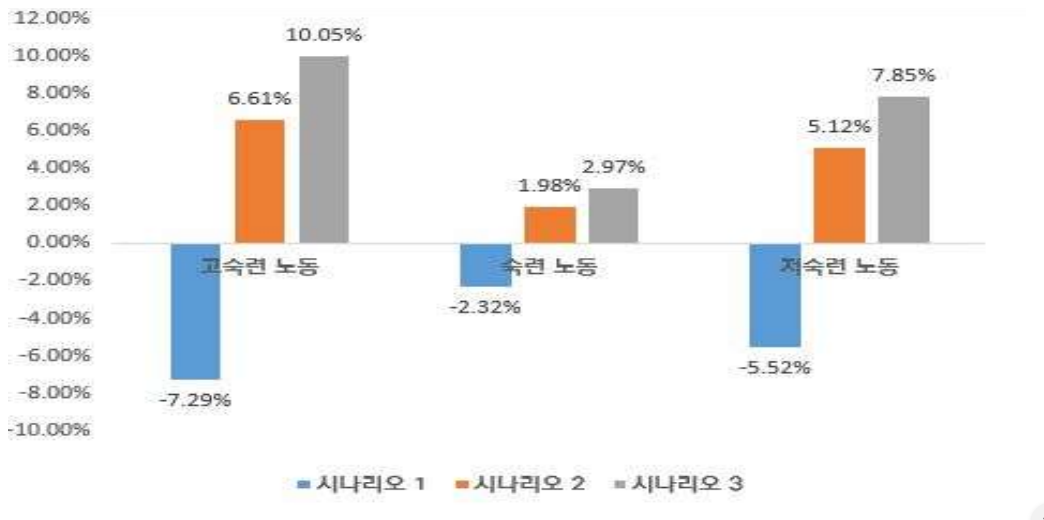
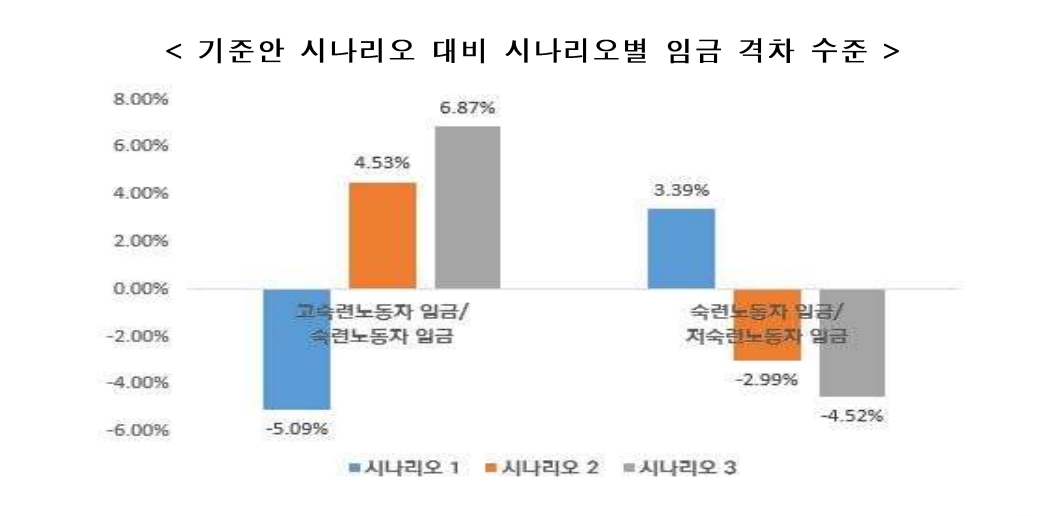
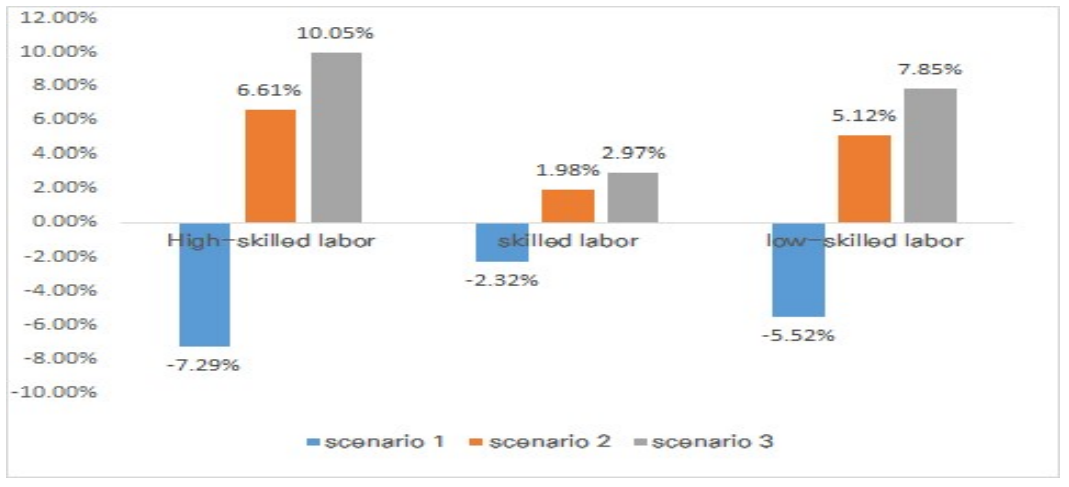
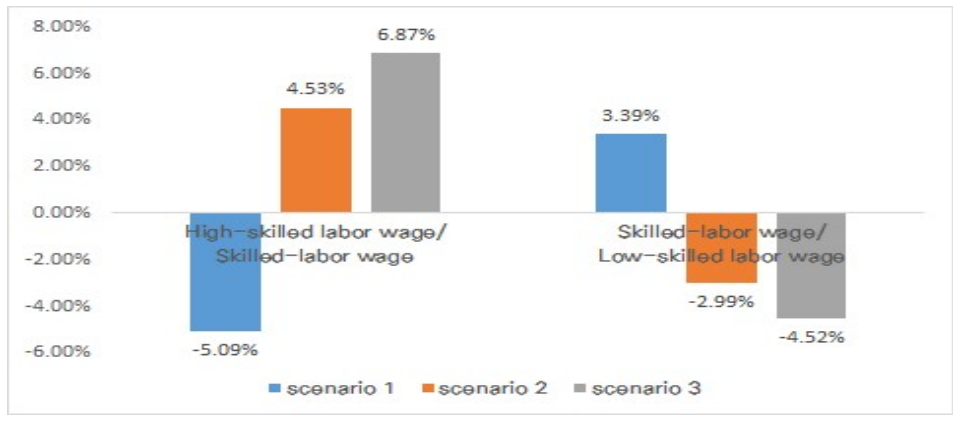
| 시나리오 | 기준안 | 시나리오1 | 시나리오2 | 시나리오3 |
|---|---|---|---|---|
| 기준안 대비 총 노동수요 수준 | - | -4.63% | 4.21% | 6.42% |
| division | production activities | production factor | institution | investment | tax | overseas division | total | ||||||||||||
|---|---|---|---|---|---|---|---|---|---|---|---|---|---|---|---|---|---|---|---|
| Domestic goods | Import goods | Labor | Capital | SW Capital | HW Capital | House hold | Firm | Gov. | Fixed capital | SW Capital | HW Capital | Indirect tax | Corporate tax | Income tax | Export | Import | |||
| production activities | Domestic goods | 24*24 | 24*10 | 24*1 | 24*1 | 24*1 | 24*1 | 24*1 | |||||||||||
| Import goods | 24*24 | 24*10 | 24*1 | 24*1 | 24*1 | 24*1 | |||||||||||||
| production factor | Labor | 3*24 | |||||||||||||||||
| Capital | 1*24 | ||||||||||||||||||
| SW Capital | 1*24 | ||||||||||||||||||
| HW Capital | 1*24 | ||||||||||||||||||
| institution | Household | 10*3 | 10*1 | 10*1 | 10*1 | ||||||||||||||
| Firm | 1*1 | 1*1 | 1*1 | ||||||||||||||||
| Gov. | 1*10 | 1*1 | 1*1 | ||||||||||||||||
| invest ment | Fixed capital formation | 1*10 | |||||||||||||||||
| SW Captial | |||||||||||||||||||
| HW Captial | |||||||||||||||||||
| tax | Indirect tax | ||||||||||||||||||
| Corporate tax | |||||||||||||||||||
| Income tax | 1*10 | ||||||||||||||||||
| Customes | 1*24 | ||||||||||||||||||
| 해외 | 수출 | ||||||||||||||||||
| 수입 | 1*24 | ||||||||||||||||||
| 총계 | |||||||||||||||||||
| Scenario | BAU | Scenario 1 | Scenario 2 | Scenario 3 |
|---|---|---|---|---|
| Total labor demand level compared to BAU | - | -4.63% | 4.21% | 6.42% |
경기도 성남시 분당구 대왕판교로 712번길 22 글로벌 R&D센터 연구동 B 4층 개인정보처리방침
Copyright © 2014-2021 By Software Policy & Research Institute.
All rights reserved.


|
|
| 항목 | 수집목적 | 보유기간 |
|---|---|---|
| 이메일 | SPRi 뉴스레터 발송, 신규 콘텐츠, SPRi 소식 등 제공 | 수신거부 시 까지 |
|
|