![[그림 1] 연구 진행 단계](/webroot/lib/fileman/Uploads/post_images/2020_03/RE_092_1.png)
| 기계학습 모델 | 설명 |
|---|---|
| 로지스틱 회귀 | 종속 변수가 0이나 1인 이진형 변수에서 자주 사용하는 분류 방식 |
| Support Vector Machine(SVM) |
입력 공간과 관련된 비선형 문제를 고차원 공간의 선형문제로 사상(projection)시켜 나타냄 |
| 다항 나이브 베이즈 | 신뢰도가 높고 효율적인 문서 분류기로 널리 사용되는 기분 문서 분류 방법 |
![[그림 2] 모델별 정확도 실험 결과](/webroot/lib/fileman/Uploads/post_images/2020_03/RE_092_2.png)
| 구분 | 단계 (Scale) |
정밀도 (Precision) |
재현율 (Recall) |
f1- score |
|---|---|---|---|---|
| tf-idf | High | 0.59 | 0.76 | 0.67 |
| Med High | 0.17 | 0.06 | 0.09 | |
| Medium | 0.18 | 0.07 | 0.09 | |
| Med Low | 0.22 | 0.06 | 0.09 | |
| Low | 0.83 | 0.95 | 0.89 | |
| 정확도 (Accuracy) |
Accurate matches:72.78% Combined matches:75.31% Adjacent matches:84.50% |
|||
| doc2vec | High | 0.57 | 0.75 | 0.64 |
| Med High | 0.21 | 0.09 | 0.12 | |
| Medium | 0.10 | 0.05 | 0.07 | |
| Med Low | 0.07 | 0.01 | 0.03 | |
| Low | 0.82 | 0.94 | 0.88 | |
| 정확도 (Accuracy) |
Accurate matches:70.11% Combined matches:73.19% Adjacent matches:82.57% |
|||
| 5단계 | 3단계 | 2단계 | |||||||
|---|---|---|---|---|---|---|---|---|---|
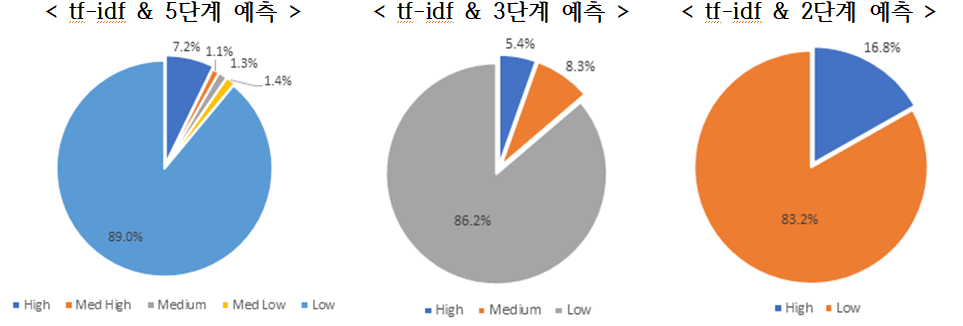
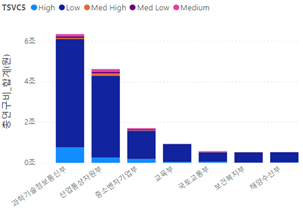
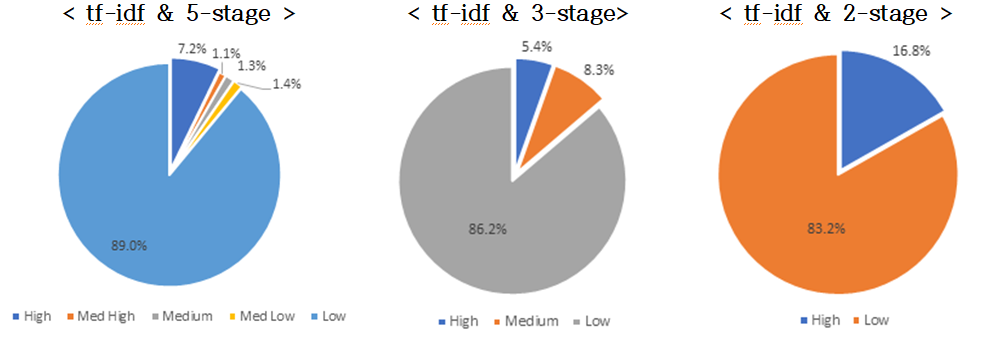
| tf-idf | High | 4,012 | 7.22% | High | 3,022 | 5.44% | High | 9,325 | 16.78% |
| Med High | 587 | 1.06% | Medium | 4,623 | 8.32% | Low | 46,241 | 83.22% | |
| Medium | 746 | 1.34% | Low | 47,920 | 86.24% | ||||
| Med Low | 776 | 1.40% | |||||||
| Low | 49,445 | 88.98% | |||||||
| doc2vec | High | 3,499 | 6.30% | High | 3,005 | 5.41% | High | 8,107 | 14.28% |
| Med High | 668 | 1.20% | Medium | 4,463 | 8.03% | Low | 48,678 | 85.72% | |
| Medium | 1,070 | 1.96% | Low | 48,098 | 86.56% | ||||
| Med Low | 1,313 | 2.36% | |||||||
| Low | 49,017 | 88.21% | |||||||
| 5단계 | 3단계 | 2단계 | |||||||
|---|---|---|---|---|---|---|---|---|---|
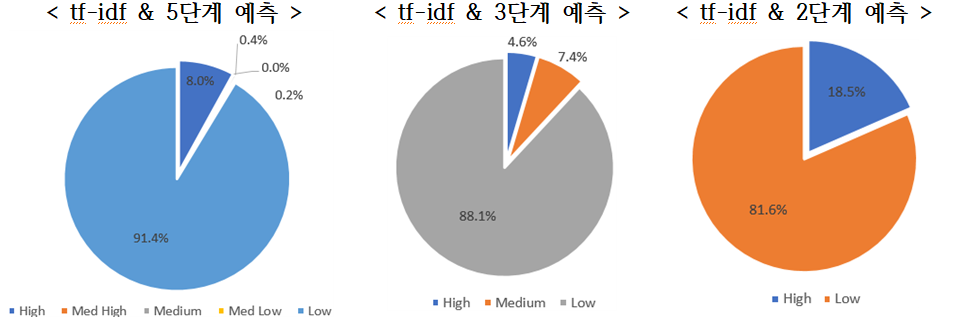
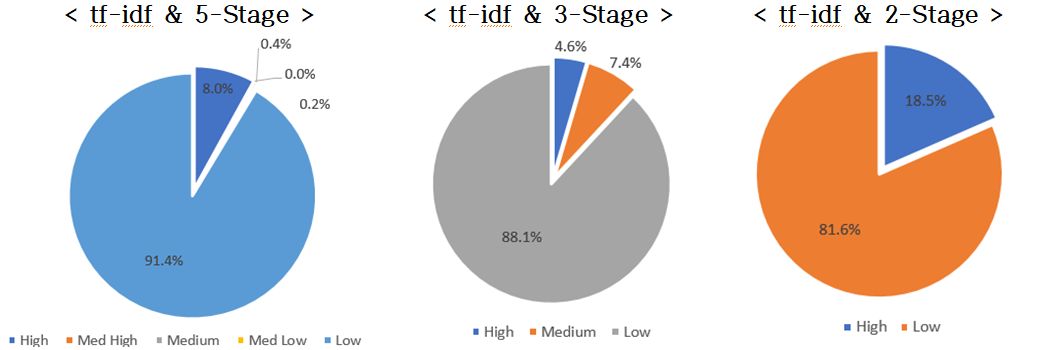
| tf-idf | High | 4,513 | 7.95% | High | 2,590 | 4.56% | High | 10,477 | 18.45% |
| Med High | 9 | 0.02% | Medium | 4,185 | 7.37% | Low | 46,308 | 81.55% | |
| Medium | 241 | 0.42% | Low | 50,010 | 88.07% | ||||
| Med Low | 109 | 0.19% | |||||||
| Low | 51,913 | 91.42% | |||||||
| doc2vec | High | 3,736 | 6.58% | High | 2,534 | 4.46% | High | 10,129 | 17.84% |
| Med High | 0 | 0.00% | Medium | 3,976 | 7.00% | Low | 46,656 | 82.16% | |
| Medium | 89 | 0.16% | Low | 50,275 | 88.54% | ||||
| Med Low | 200 | 0.35% | |||||||
| Low | 52,760 | 92.91% | |||||||
| 전문가 예측 | 개수 | 정 매칭 | 인접 매칭 | 비 매칭 | |||
|---|---|---|---|---|---|---|---|
| 개수 | 비중 | 개수 | 비중 | 개수 | 비중 | ||
| High | 8 | 6 | 75.0% | 0 | 0.0% | 2 | 25.0% |
| Med High | 6 | 1 | 16.7% | 1 | 16.7% | 4 | 66.7% |
| Medium | 6 | 1 | 16.7% | 0 | 0.0% | 5 | 83.3% |
| Med Low | 2 | 0 | 0.0% | 2 | 100.0% | 0 | 0.0% |
| Low | 78 | 78 | 100.0% | 0 | 0.0% | 0 | 0.0% |
| 합계 | 100 | 86 | 86.0% | 3 | 3.0% | 11 | 11.0% |
| Algorithm | Scale | Precision | Recall | f1- score |
|---|---|---|---|---|
| tf-idf | High | 0.59 | 0.76 | 0.67 |
| Med High | 0.17 | 0.06 | 0.09 | |
| Medium | 0.18 | 0.07 | 0.09 | |
| Med Low | 0.22 | 0.06 | 0.09 | |
| Low | 0.83 | 0.95 | 0.89 | |
| Accuracy | Accurate matches:72.78% Combined matches:75.31% Adjacent matches:84.50% |
|||
| doc2vec | High | 0.57 | 0.75 | 0.64 |
| Med High | 0.21 | 0.09 | 0.12 | |
| Medium | 0.10 | 0.05 | 0.07 | |
| Med Low | 0.07 | 0.01 | 0.03 | |
| Low | 0.82 | 0.94 | 0.88 | |
| Accuracy | Accurate matches:70.11% Combined matches:73.19% Adjacent matches:82.57% |
|||
| Stage 5 | Stage 3 | Stage 2 | |||||||
|---|---|---|---|---|---|---|---|---|---|
| tf-idf | High | 4,012 | 7.22% | High | 3,022 | 5.44% | High | 9,325 | 16.78% |
| Med High | 587 | 1.06% | Medium | 4,623 | 8.32% | Low | 46,241 | 83.22% | |
| Medium | 746 | 1.34% | Low | 47,920 | 86.24% | ||||
| Med Low | 776 | 1.40% | |||||||
| Low | 49,445 | 88.98% | |||||||
| doc2vec | High | 3,499 | 6.30% | High | 3,005 | 5.41% | High | 8,107 | 14.28% |
| Med High | 668 | 1.20% | Medium | 4,463 | 8.03% | Low | 48,678 | 85.72% | |
| Medium | 1,070 | 1.96% | Low | 48,098 | 86.56% | ||||
| Med Low | 1,313 | 2.36% | |||||||
| Low | 49,017 | 88.21% | |||||||
| Stage 5 | Stage 3 | Stage 2 | ||||||||
|---|---|---|---|---|---|---|---|---|---|---|
| tf-idf | High | 4,513 | 7.95% | High | 2,590 | 4.56% | High | 10,477 | 18.45% | |
| Med High | 9 | 0.02% | Medium | 4,185 | 7.37% | Low | 46,308 | 81.55% | ||
| Medium | 241 | 0.42% | Low | 50,010 | 88.07% | |||||
| Med Low | 109 | 0.19% | ||||||||
| Low | 51,913 | 91.42% | ||||||||
| doc2vec | High | 3,736 | 6.58% | High | 2,534 | 4.46% | High | 10,129 | 17.84% | |
| Med High | 0 | 0.00% | Medium | 3,976 | 7.00% | Low | 46,656 | 82.16% | ||
| Medium | 89 | 0.16% | Low | 50,275 | 88.54% | |||||
| Med Low | 200 | 0.35% | ||||||||
| Low | 52,760 | 92.91% | ||||||||
| Expert Prediction | Count | Accurate Matching | Adjacent Matching | Non-Matching | |||
|---|---|---|---|---|---|---|---|
| Count | Percent | Count | Percent | Count | Percent | ||
| High | 8 | 6 | 75.0% | 0 | 0.0% | 2 | 25.0% |
| Med High | 6 | 1 | 16.7% | 1 | 16.7% | 4 | 66.7% |
| Medium | 6 | 1 | 16.7% | 0 | 0.0% | 5 | 83.3% |
| Med Low | 2 | 0 | 0.0% | 2 | 100.0% | 0 | 0.0% |
| Low | 78 | 78 | 100.0% | 0 | 0.0% | 0 | 0.0% |
| 합계 | 100 | 86 | 86.0% | 3 | 3.0% | 11 | 11.0% |
경기도 성남시 분당구 대왕판교로 712번길 22 글로벌 R&D센터 연구동 B 4층 개인정보처리방침
Copyright © 2014-2021 By Software Policy & Research Institute.
All rights reserved.


|
|
| 항목 | 수집목적 | 보유기간 |
|---|---|---|
| 이메일 | SPRi 뉴스레터 발송, 신규 콘텐츠, SPRi 소식 등 제공 | 수신거부 시 까지 |
|
|